Dart DevTools is a suite of debugging and performance tools
for Dart and Flutter.
These tools are distributed in IDEs, the flutter tool, the webdev tool,
and the devtools package.
The following table shows which tools you can use with common Dart app types.
| Flutter mobile app | Flutter web app | Other web app | Command-line app | |
|---|---|---|---|---|
| Debugger | ||||
| Logging view | ||||
| Timeline view | ||||
| Memory view | ||||
| Performance view | ||||
| Flutter inspector |
For information about using Dart DevTools with each app type (for example, command-line apps), click the app type in the top row. For details about individual tools (for example, the debugger), click the tool name in the left column.
As the table shows, the debugger and the logging view are the only parts of Dart DevTools that are available to all app types. Web apps can’t use the timeline, memory, and performance views; instead, they can use browser tools such as the Chrome DevTools. The Flutter inspector works only for Flutter apps; other web apps should use browser tools such as the Chrome DevTools.
Using DevTools with a Flutter app
For details on using DevTools with a Flutter app for any platform (including web) see the DevTools documentation on flutter.dev.
Using DevTools with a non-Flutter web app
To launch a web app so that you can use Dart DevTools,
use the webdev serve command with the --debug or --debug-extension flag:
$ webdev serve --debug
For more information, see Debugging Dart web apps.
Using DevTools with a command-line app
You can use DevTools to perform source-level debugging or to view general log and diagnostics information for a running command-line app.
1. Install DevTools
Use pub to install or update DevTools:
$ dart pub global activate devtools
2. Launch the DevTools server
Once you have DevTools, use the devtools command
to run the local web server for DevTools:
$ dart pub global run devtools
Serving DevTools at http://127.0.0.1:9100
3. Start the target app
Use the dart run --observe command to execute the main file
for the Dart command-line app that you want to debug or observe.
Optionally add --pause-isolates-on-start,
which automatically breaks execution at the start of the script.
$ cd path/to/dart/app
$ dart run --observe main.dart

Observatory listening on http://127.0.0.1:8181/wYDP3x9mvbw=/
Note the “listening” URL. You’ll need this URL in the next step.
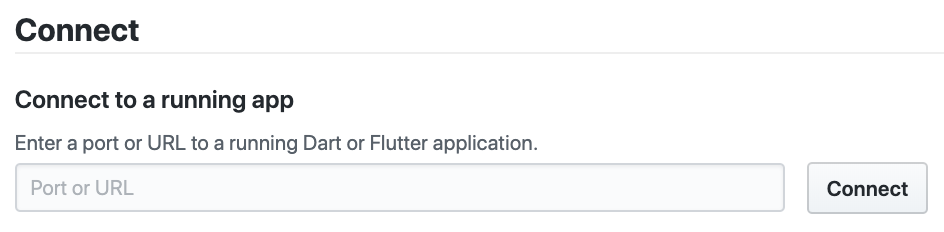
4. Open DevTools and connect to the target app
- Open Chrome browser window and navigate to
http://localhost:9100. - Paste the “listening” URL into the text field under Connect to a running app, and click the Connect button.