Use the dart2js tool to compile Dart code to deployable JavaScript.
Another Dart-to-JavaScript compiler, dartdevc, is for development use only.
The webdev build command uses dart2js by default.
The webdev serve command uses dartdevc by default, but you can switch
to dart2js using the --release flag.
The dart2js tool provides hints for improving your Dart code and removing
unused code.
Also see dart analyze,
which performs a similar analysis but has a different implementation.
This page tells you how to use dart2js on the command line. It also give tips on debugging the JavaScript that dart2js generates.
Basic usage
Here’s an example of compiling a Dart file to JavaScript:
$ dart2js -O2 -o test.js test.dart
This command produces a file that contains the JavaScript equivalent of your Dart code. It also produces a source map, which can help you debug the JavaScript version of the app more easily.
Build config usage
You can also configure dart2js options in a build config file. For more information, see the build_web_compilers package.
Options
Basic options
Common command-line options for dart2js include:
-
-o <file>or--out=<file> - Generates the output into
<file>. If not specified, the output goes in a file namedout.js. --enable-asserts- Enables assertion checking.
-O{0|1|2|3|4}- Controls optimizations that can help reduce code size and
improve performance of the generated code.
For more details on these optimizations, run
dart2js -hv.-
-O0: Disables many optimizations. -
-O1: Enables default optimizations. -
-O2: Enables-O1optimizations, plus additional ones (such as minification) that respect the language semantics and are safe for all programs. -
-O3: Enables-O2optimizations, plus omits implicit type checks. -
-O4: Enables more aggressive optimizations than-O3, but with the same assumptions.
-
-
-hor--help - Displays help. To get information about all options, use
-hv.
Path and environment options
Some other handy options include:
--packages=<path>- Specifies the path to the package resolution configuration file. For more information, see Package Resolution Configuration File.
-D<flag>=<value>- Defines an environment variable.
--version- Displays version information for dart2js.
Display options
The following options help you control the output of dart2js:
--suppress-warnings- Doesn’t display warnings.
--suppress-hints- Doesn’t display hints.
--terse- Emits diagnostics, without suggesting how to get rid of the diagnosed problems.
-
-vor--verbose - Displays lots of information.
Analysis options
The following options control the analysis that dart2js performs on Dart code:
--enable-diagnostic-colors- Adds colors to diagnostic messages.
--show-package-warnings- Shows warnings and hints generated from packages.
--csp- Disables dynamic generation of code in the generated output. This is necessary to satisfy CSP restrictions (see W3C Content Security Policy.)
--dump-info- Generates a file (with the suffix
.info.json) that contains information about the generated code. You can inspect the generated file with the Dump Info Visualizer.
Helping dart2js generate better code
Follow these practices to help dart2js do better type inference, so it can generate smaller and faster JavaScript code:
- Don’t use
Function.apply(). - Don’t override
noSuchMethod(). - Avoid setting variables to null.
- Be consistent with the types of arguments you pass into each function or method.
Debugging
This section gives tips for debugging dart2js-produced code in Chrome, Firefox, and Safari. Debugging the JavaScript produced by dart2js is easiest in browsers such as Chrome that support source maps.
Whichever browser you use, you should enable pausing on at least uncaught exceptions, and perhaps on all exceptions. For frameworks such as dart:async that wrap user code in try-catch, we recommend pausing on all exceptions.
Chrome
To debug in Chrome:
- Open the Developer Tools window, as described in the Chrome DevTools documentation.
- Turn on source maps, as described in the video SourceMaps in Chrome.
- Enable debugging, either on all exceptions or only on uncaught exceptions, as described in How to set breakpoints.
- Reload your app.
Edge
To debug in Edge:
- Update to the latest version of Edge.
- Load Developer Tools (F12). For more information, see Using the F12 developer tools.
- Reload the app. The debugger tab shows source-mapped files.
- Exception behavior can be controlled through Ctrl+Shift+E; the default is Break on unhandled exceptions.
Firefox
Firefox doesn’t yet support source maps (see bug #771597.)
To debug in Firefox:
-
Enable the Developer Toolbar, as described in Kevin Dangoor’s blog post, New Firefox Command Line Helps You Develop Faster”.
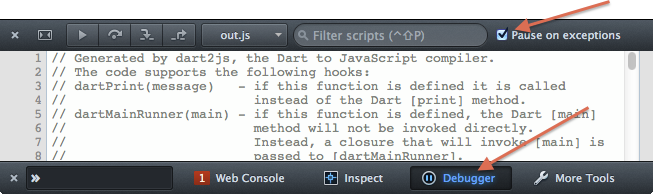
- Click Pause on exceptions, as shown in the
following figure.
- Reload your app.
Safari
To debug in Safari:
- Turn on the Develop menu, as described in the Safari Web Inspector Tutorial.
- Enable breaks, either on all exceptions or only on uncaught exceptions. See Add a JavaScript breakpoint under Safari Developer Help.
- Reload your app.